About the product
About the product
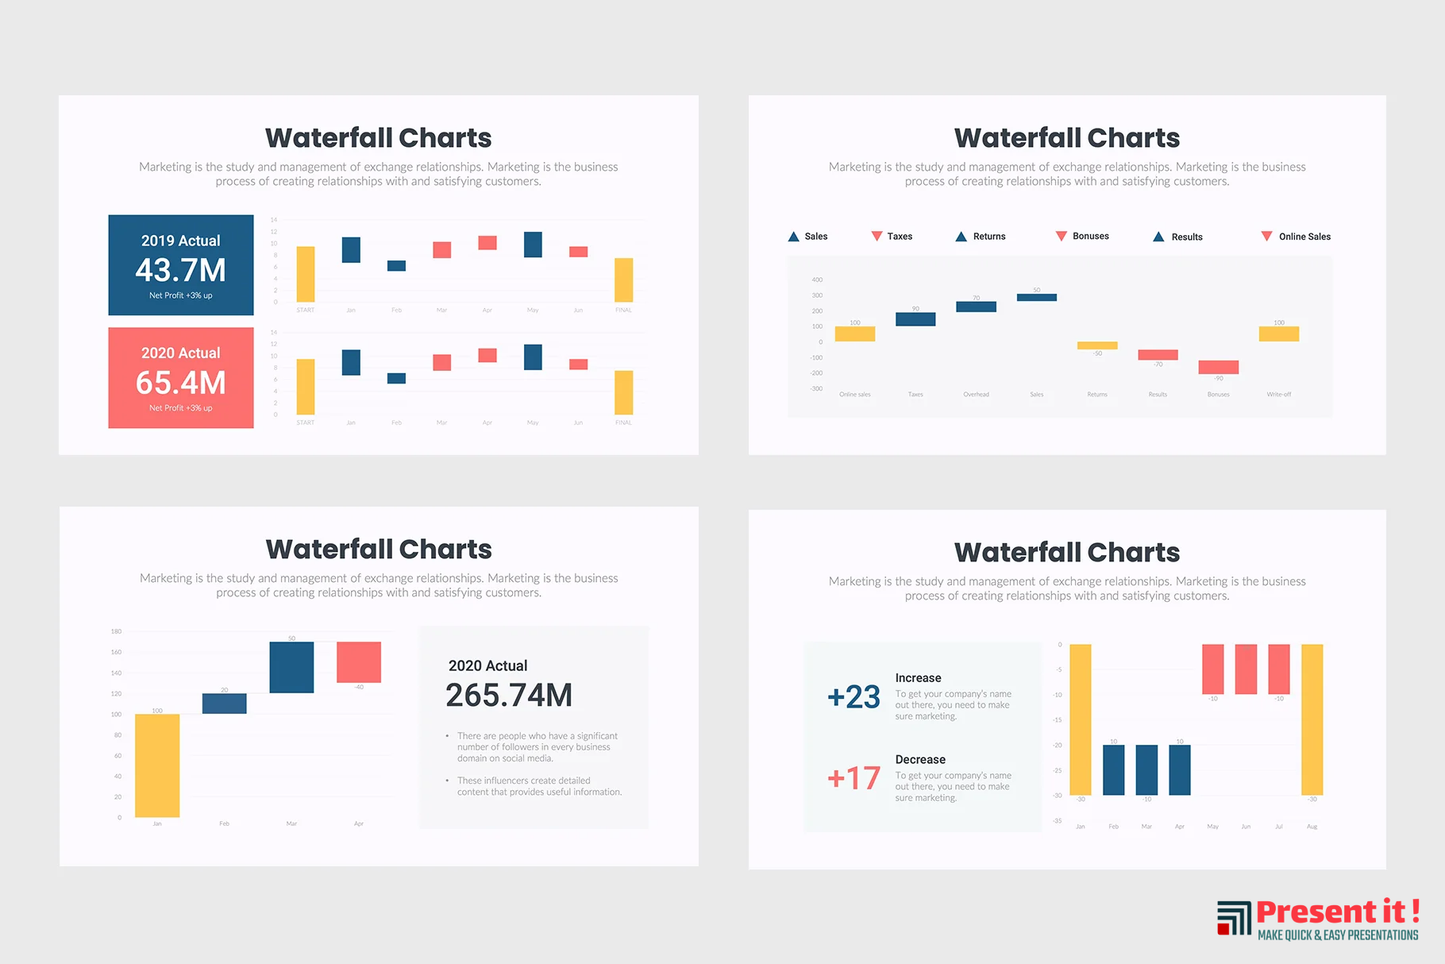
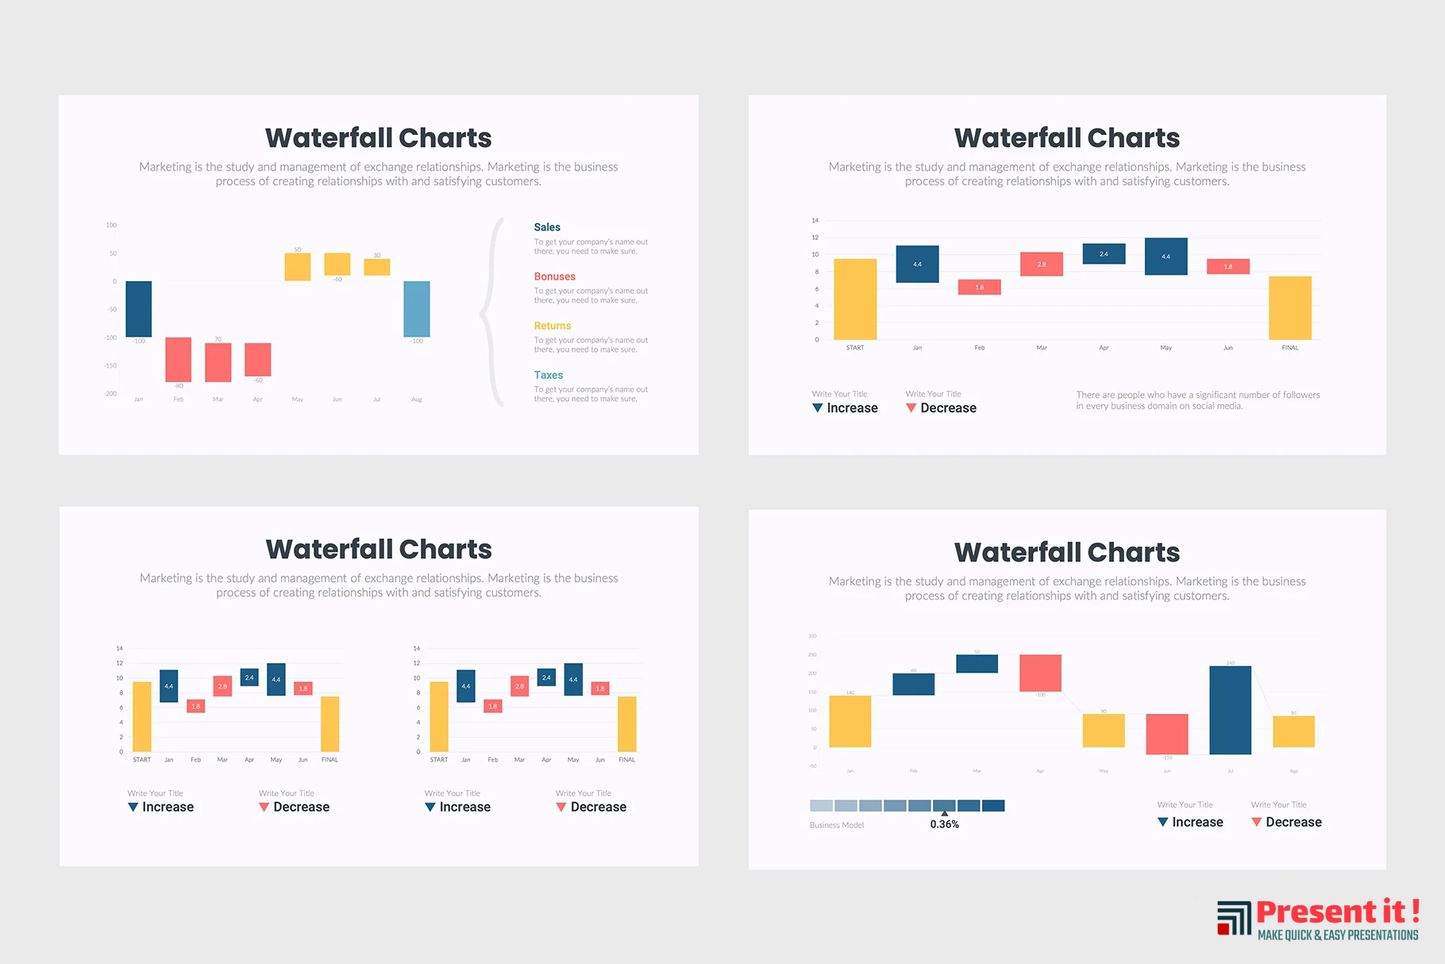
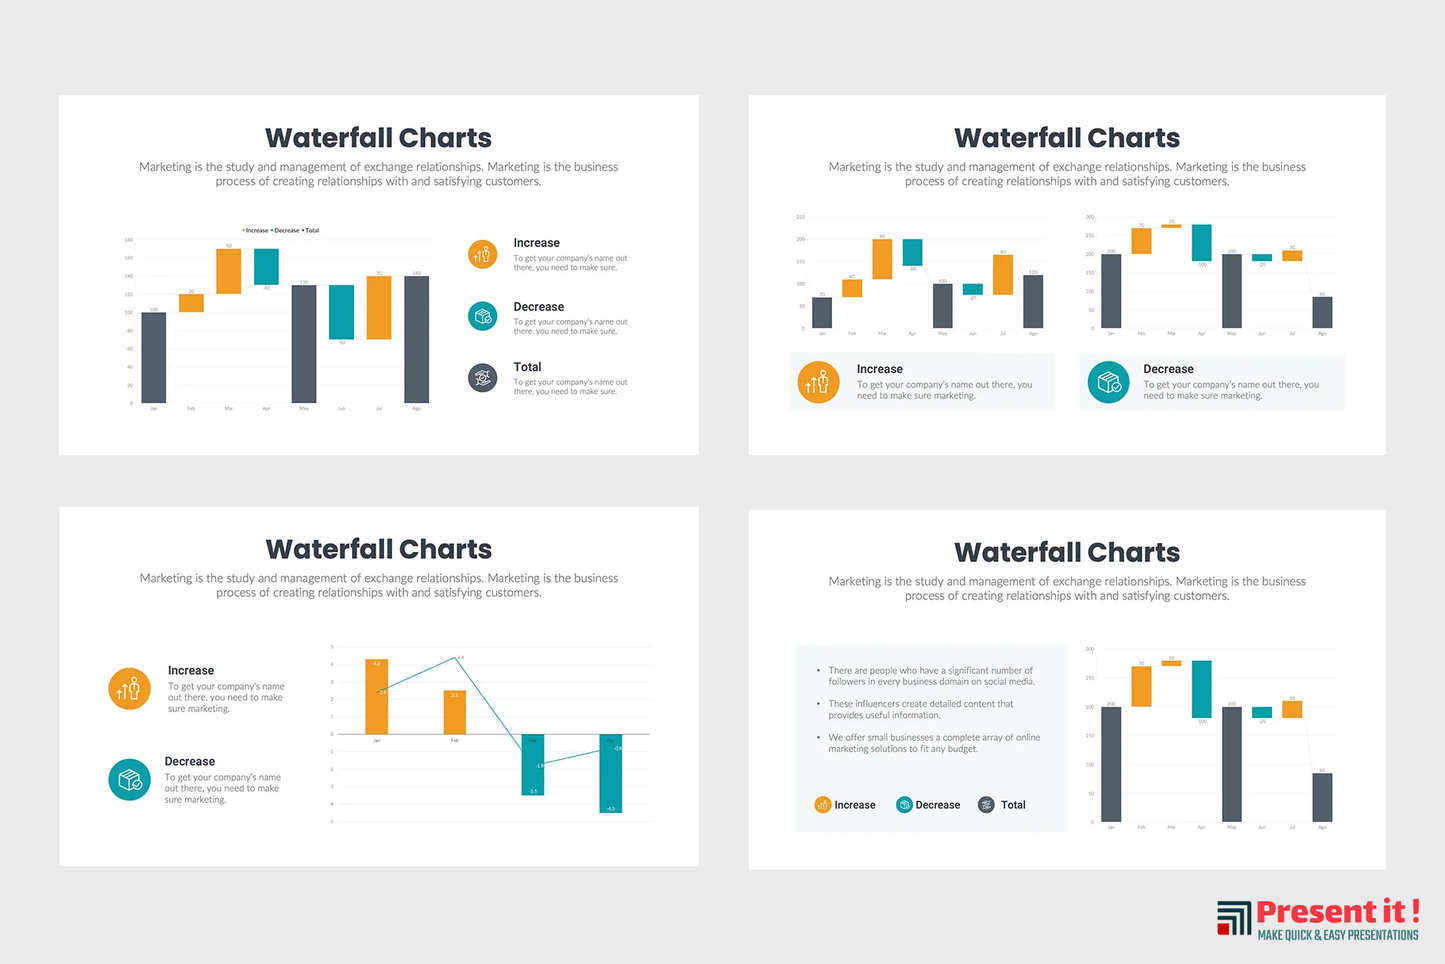
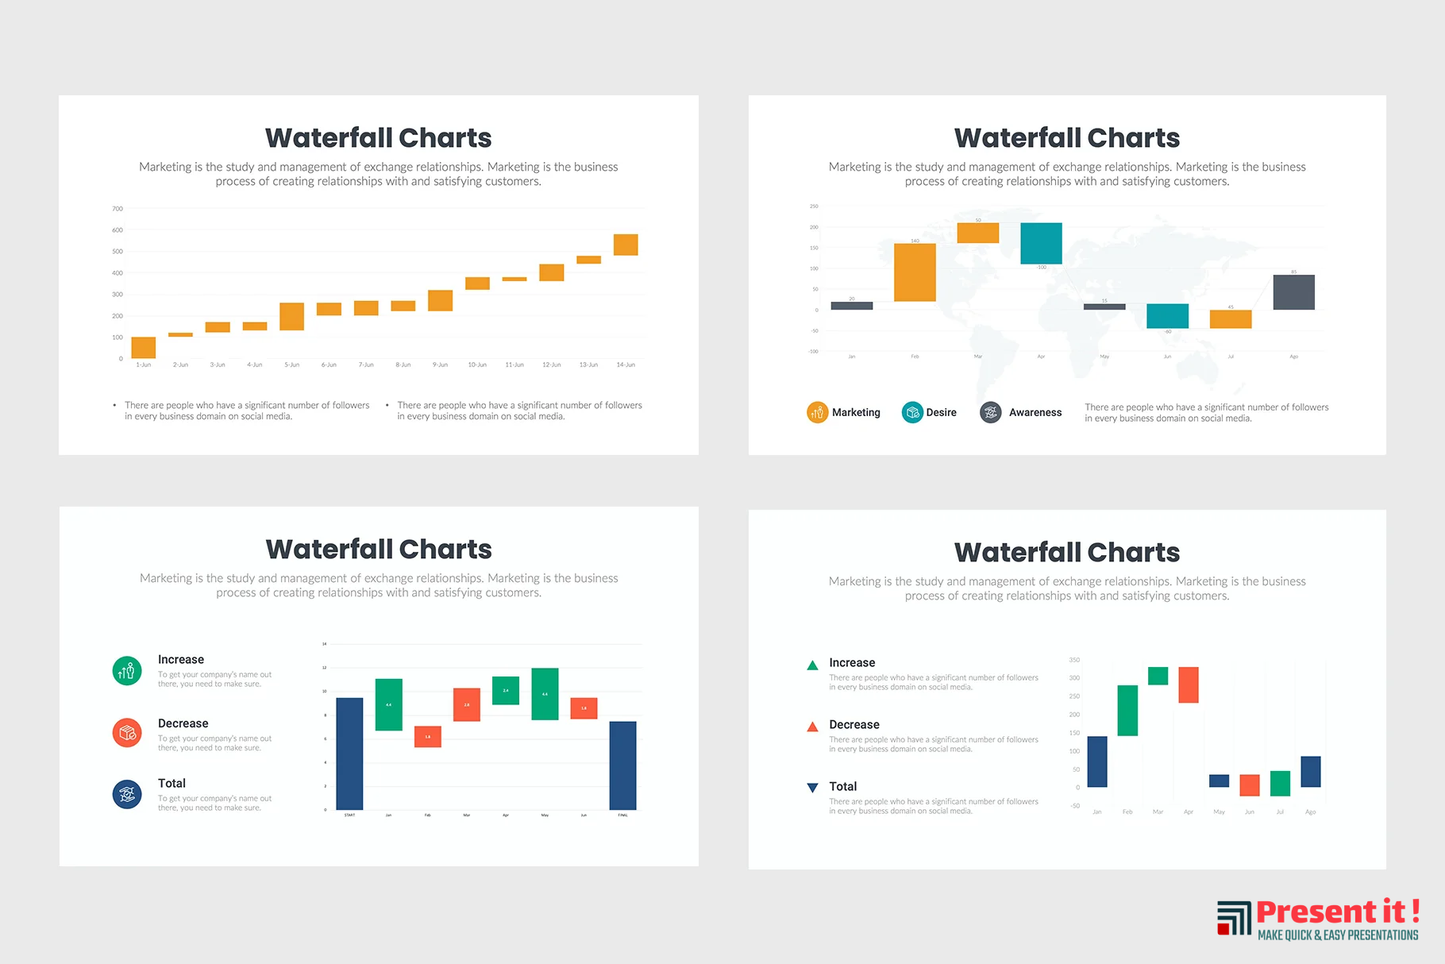
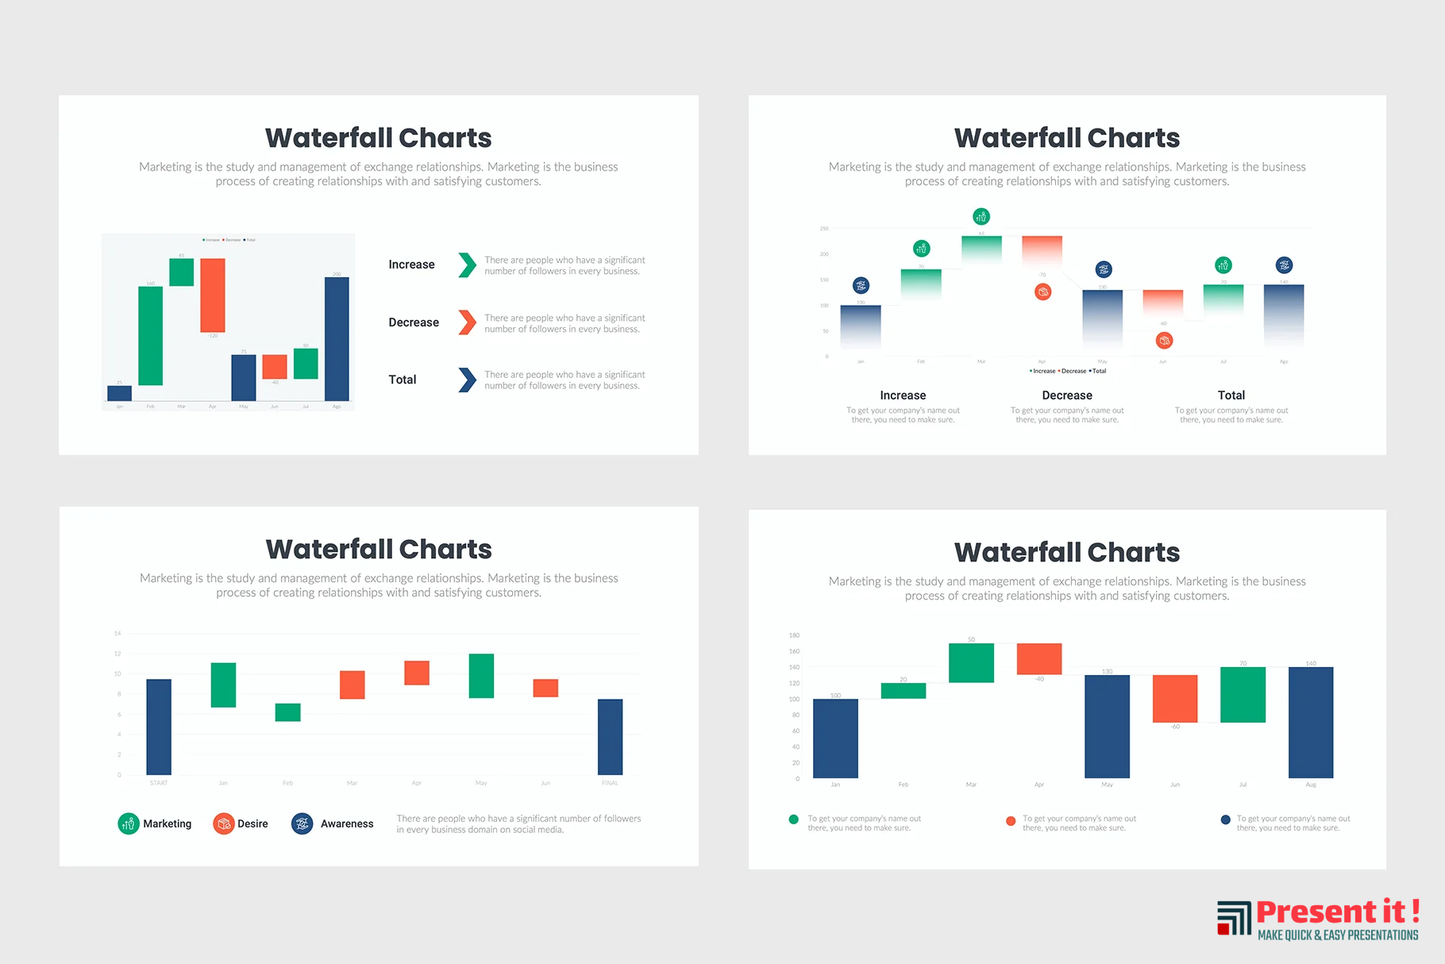
Waterfall Charts is a graphic presentation of data about your company's performance over time, showing the flow of money in various income and expenditure categories. It can help you measure progress and compare different strategies.
These infographics are compatible with:
- MS PowerPoint
- MS Excel
Features
Features
- Free Unique Slides and Master Slides
- Freemium Features
- Drag and Drop Ready
- Handmade Infographics
- Free Images Based on Template Category
- Free Icons
- Editable Elements and Fonts
Recommendations
Recommendations
This infographic template is great for a variety of presentations like:
- Providing a quick overview of a topic
- Explaining a complex process
- Displaying research findings or survey data
- Summarizing a long report
- Comparing multiple options
- Raising awareness about an issue or cause