About the product
About the product
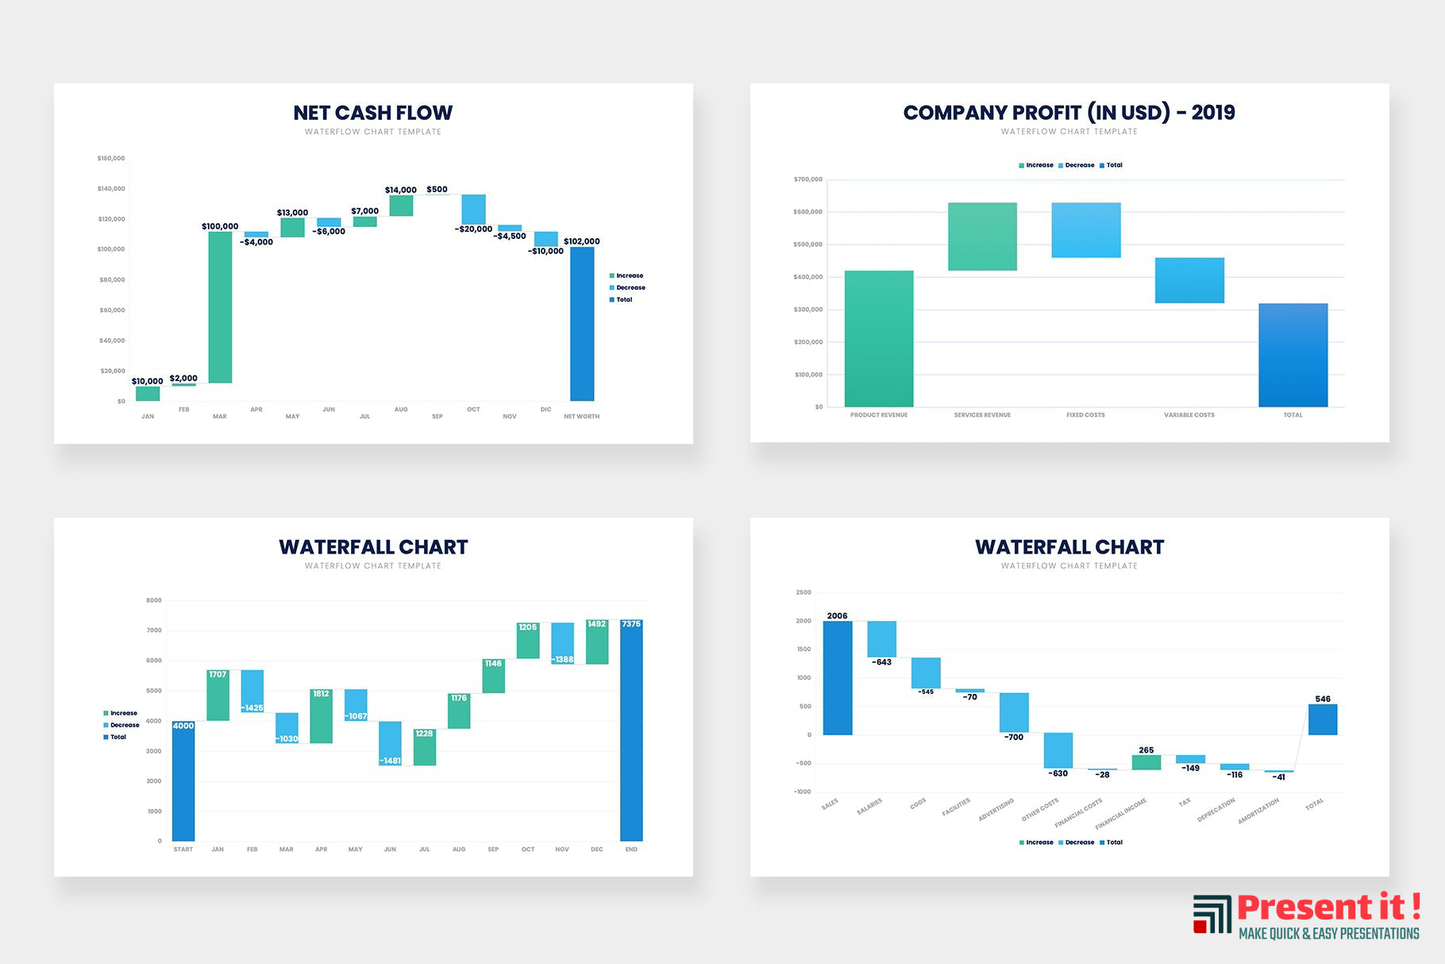
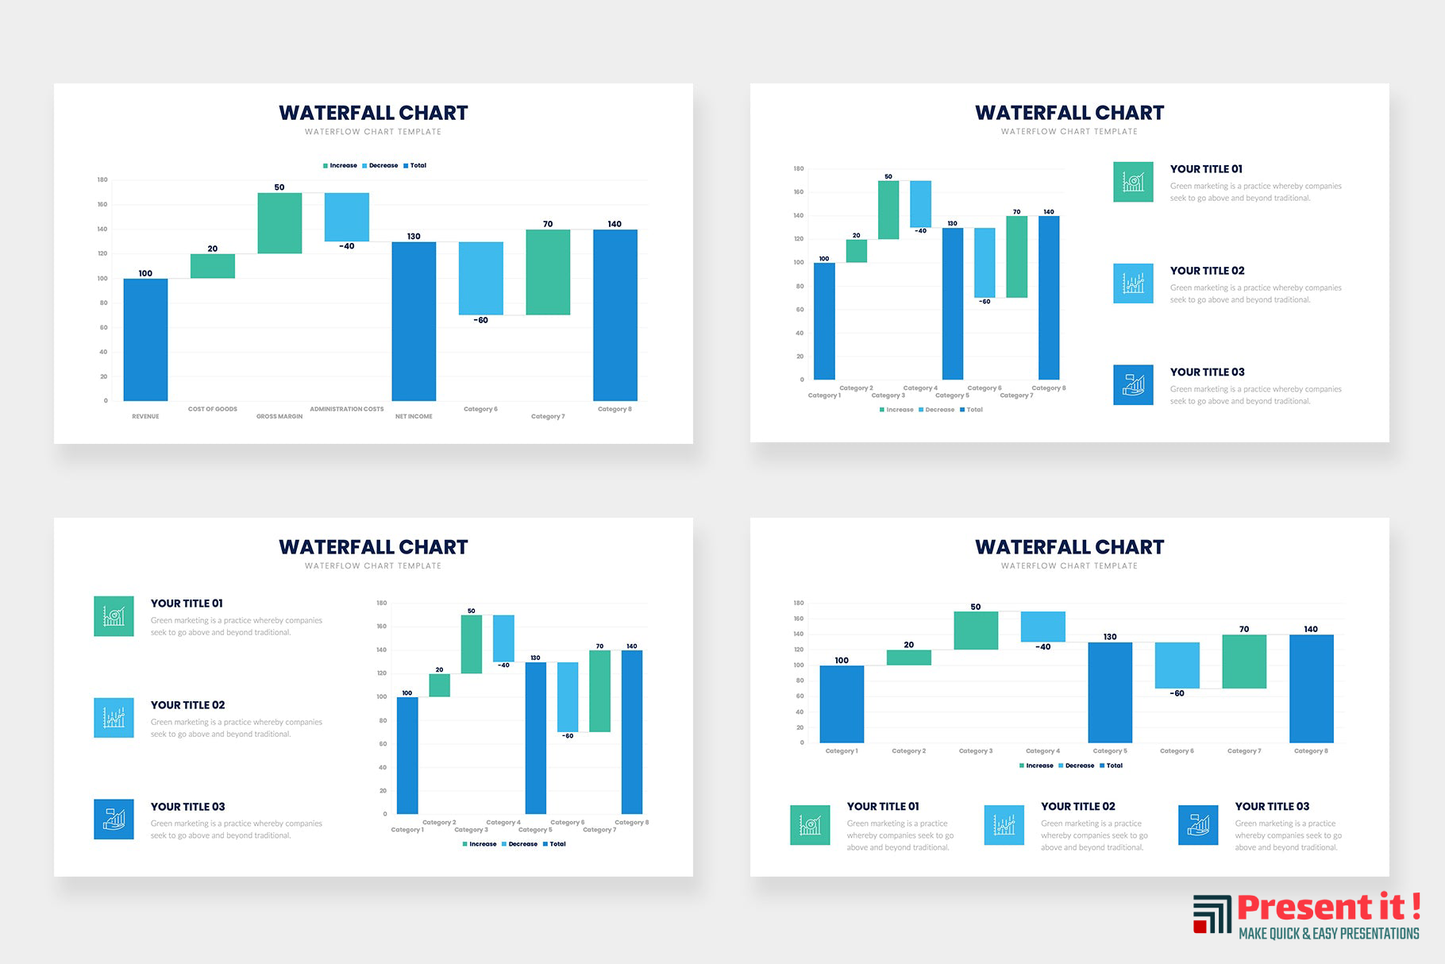
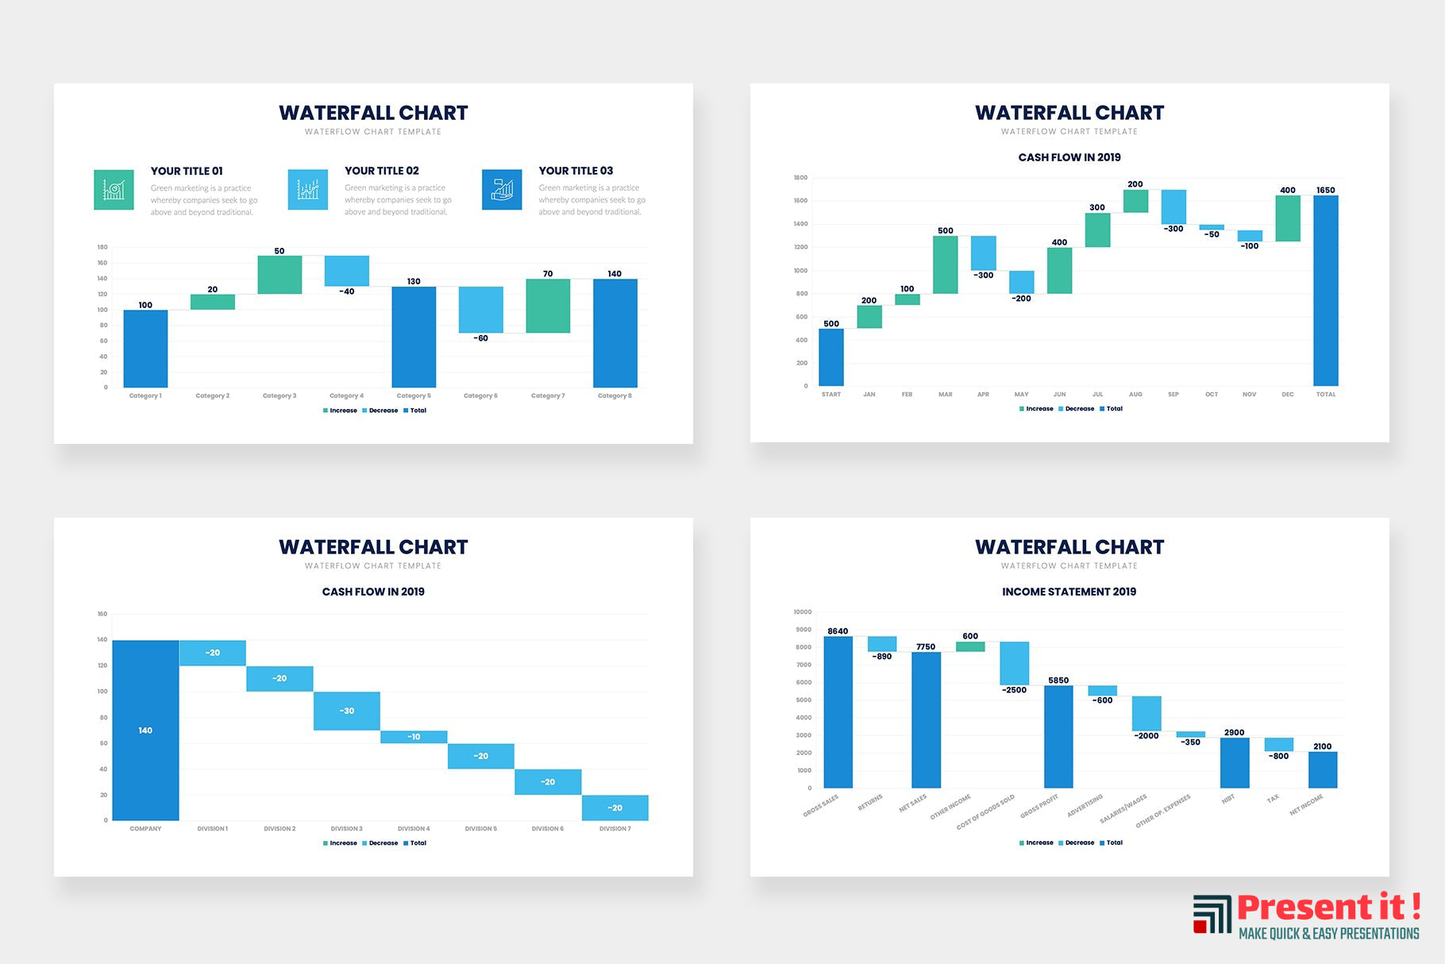
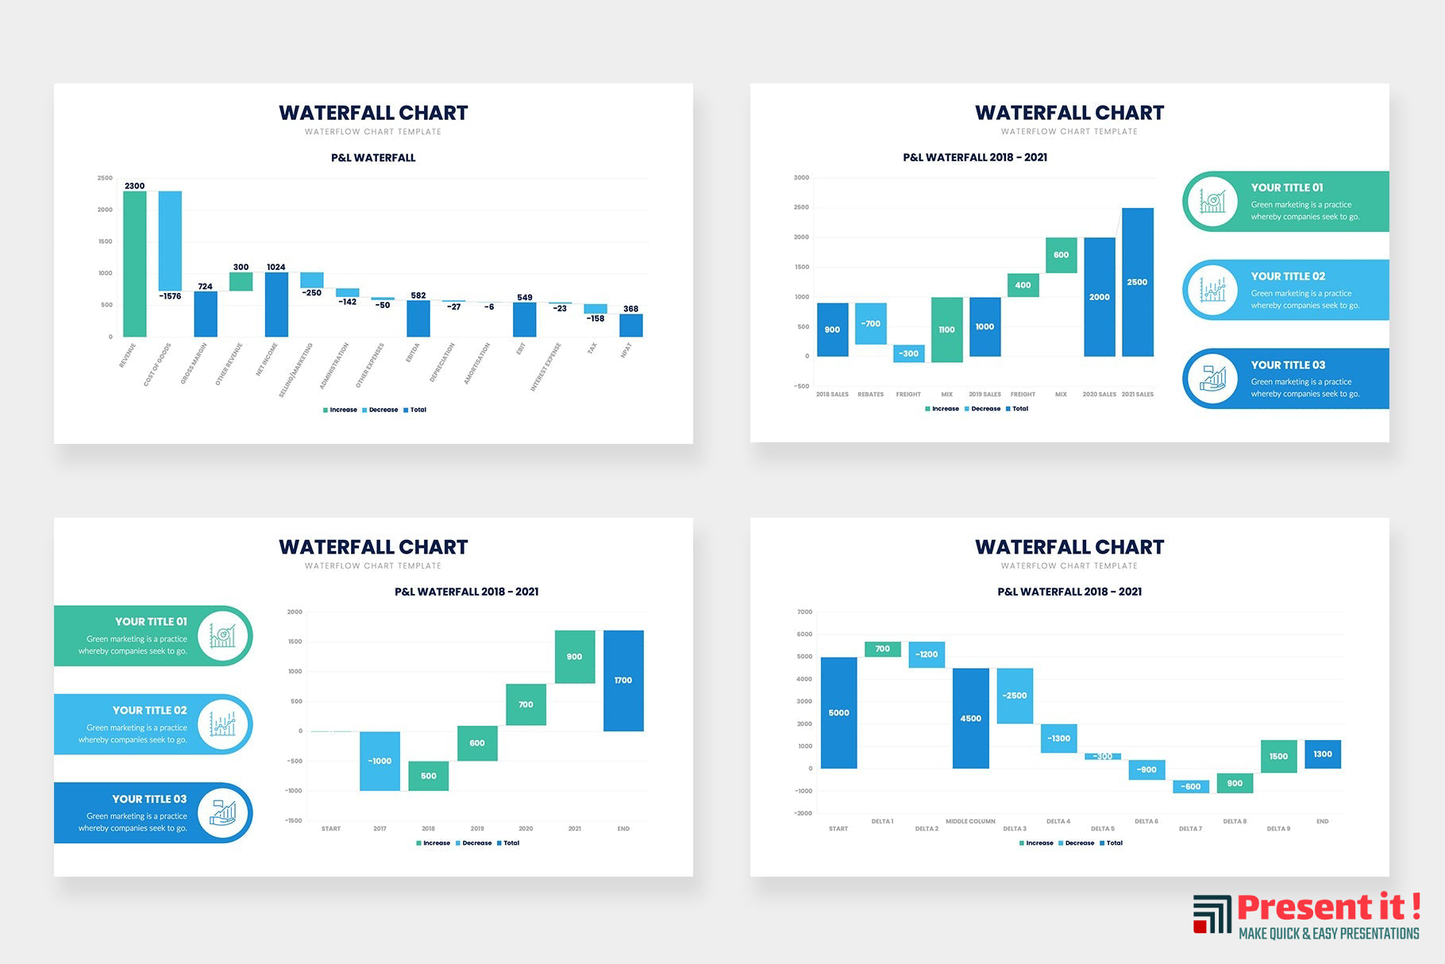
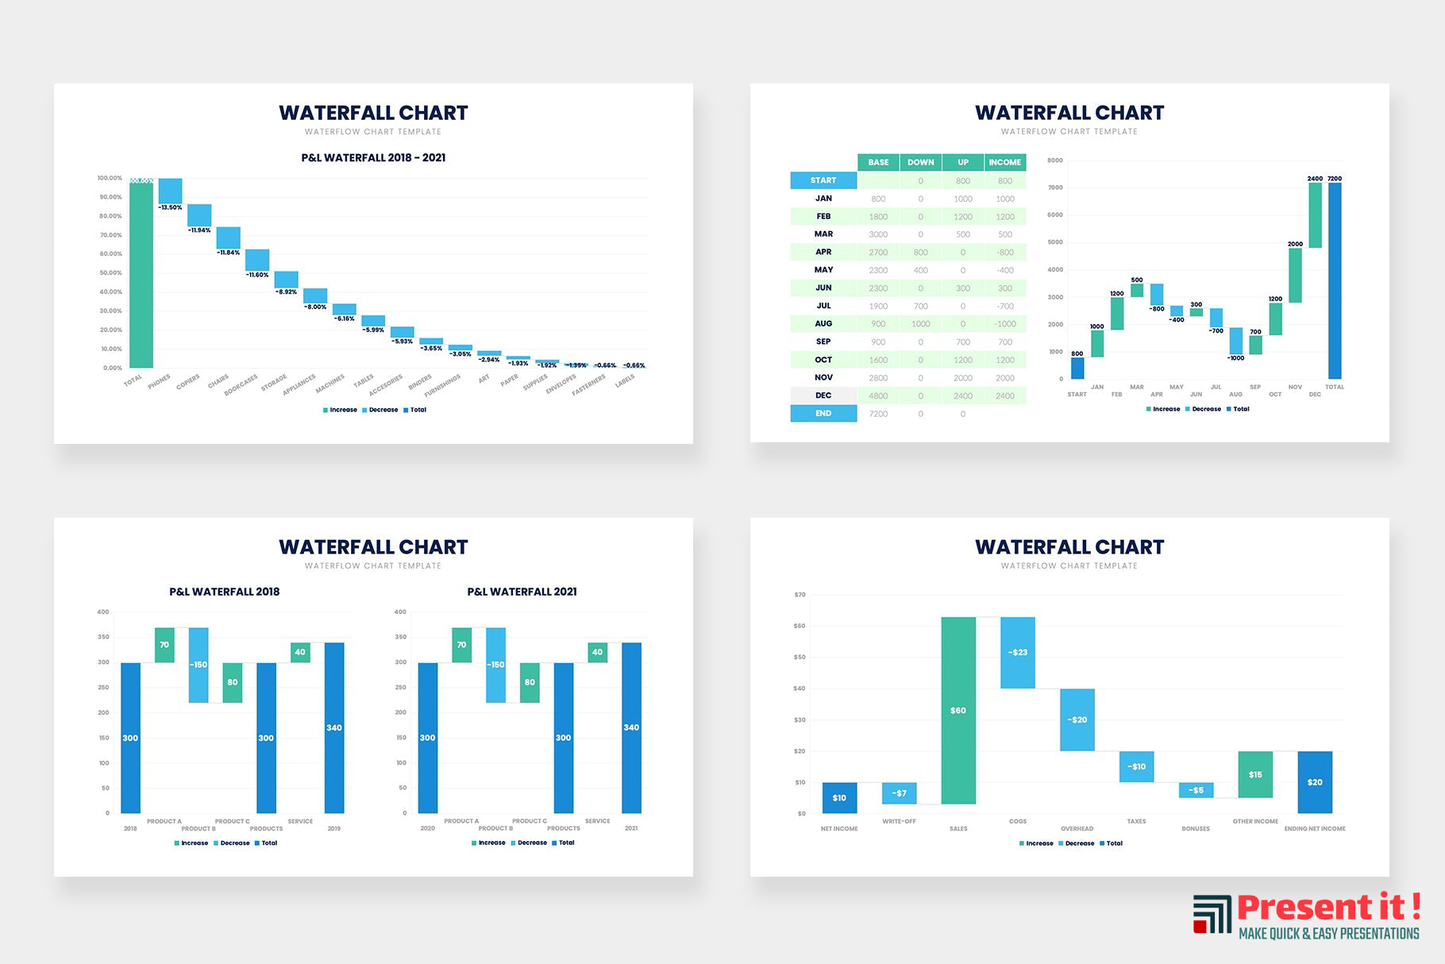
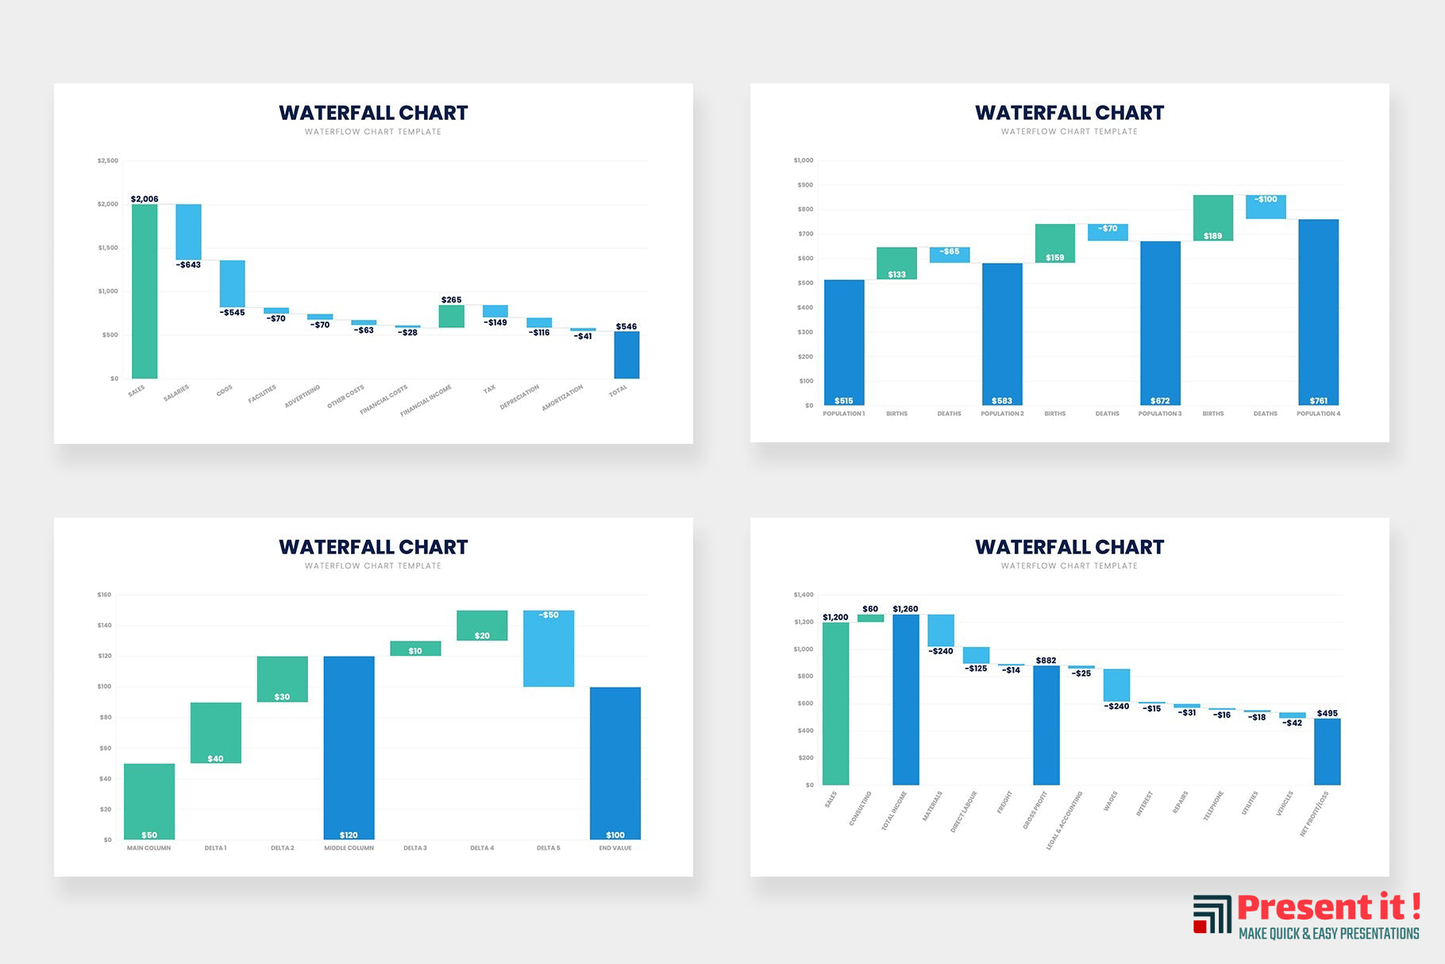
Waterfall Chart infographics compatible with Powerpoint Slides.
|
Are you looking to create a powerful and informative presentation showcasing your company’s progress? Look no further than Present it!’s Waterfall Chart Infographic. With this pack of templates, we provide all the tools necessary to effectively communicate your message and have a visually appealing presentation. Our Waterfall Chart Infographic template offers an easy way to display cumulative data in a cascade of columns that represent increase and decrease over time. Perfect for keeping track of financial statements, or displaying demographic trends and research results, our waterfall chart infographics are designed with highly-stylized visuals for an engaging, persuasive presentation. Plus, with this collection of slides, all templates are fully editable from their fonts to their color schemes in various formats such as Present it!. Make sure your audience is captivated by delivering a stunning waterfall chart infographic today with Present it!! |
Use these Waterfall Chart diagrams for any project presentation. Easy to edit.
Features
Features
- Free Unique Slides and Master Slides
- Freemium Features
- Drag and Drop Ready
- Handmade Infographics
- Free Images Based on Template Category
- Free Icons
- Editable Elements and Fonts
Recommendations
Recommendations
This infographic template is great for a variety of presentations like:
- Providing a quick overview of a topic
- Explaining a complex process
- Displaying research findings or survey data
- Summarizing a long report
- Comparing multiple options
- Raising awareness about an issue or cause
Waterfall Chart Infographics
Waterfall Chart Infographics
Couldn't load pickup availability
About the product
About the product
Features
Features
- Free Unique Slides and Master Slides
- Freemium Features
- Drag and Drop Ready
- Handmade Infographics
- Free Images Based on Template Category
- Free Icons
- Editable Elements and Fonts
Recommendations
Recommendations
This infographic template is great for a variety of presentations like:
- Providing a quick overview of a topic
- Explaining a complex process
- Displaying research findings or survey data
- Summarizing a long report
- Comparing multiple options
- Raising awareness about an issue or cause
Product Specs
