1
/
of
6
About the product
About the product
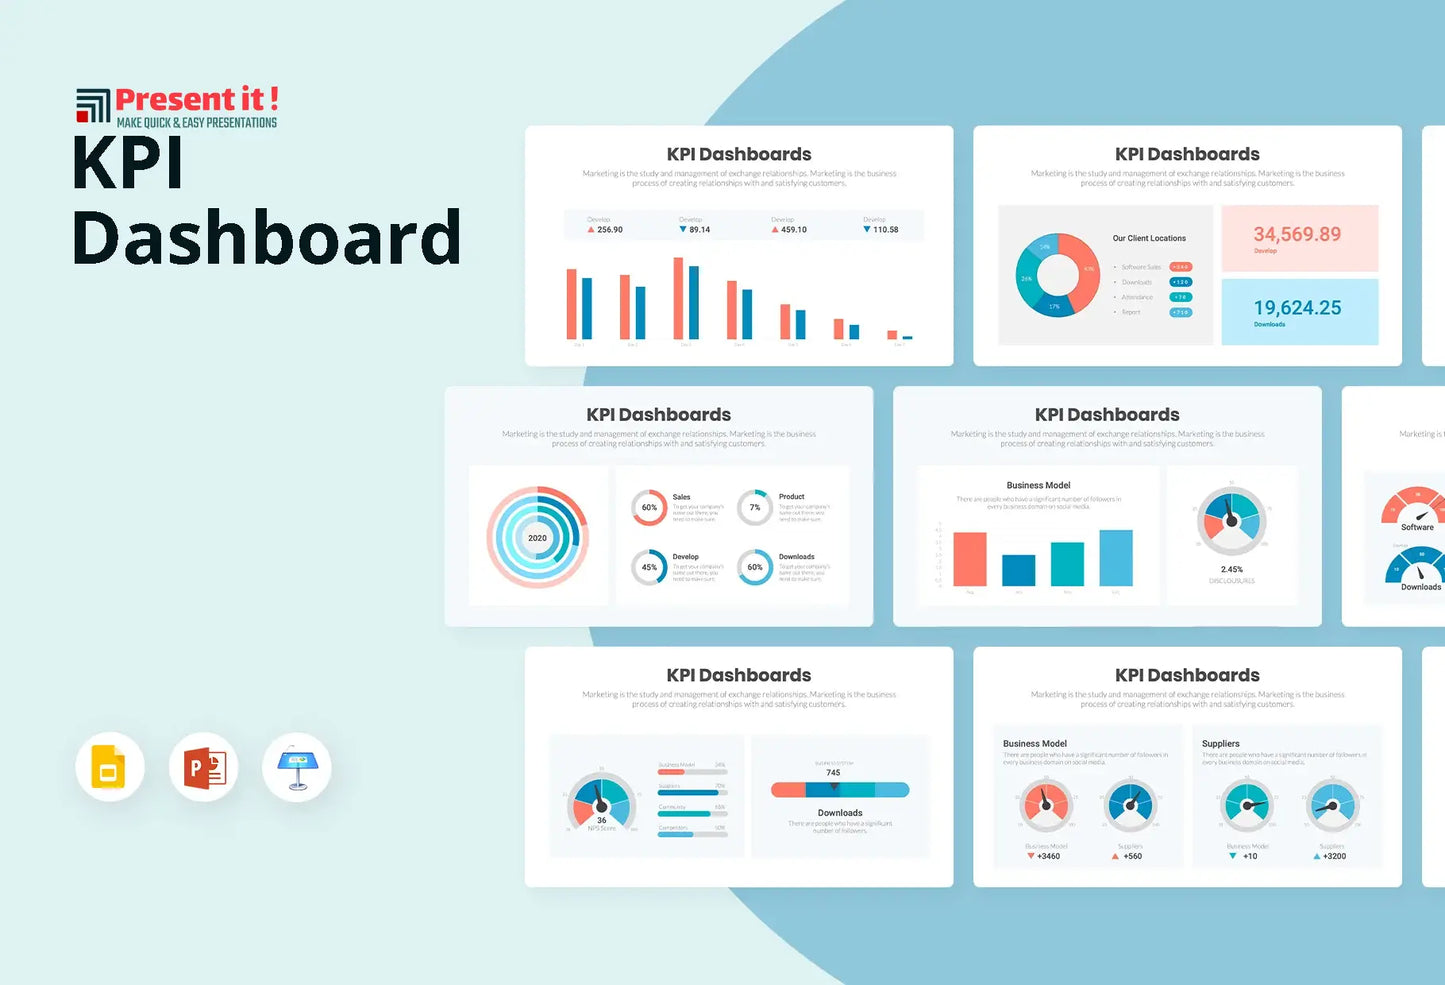
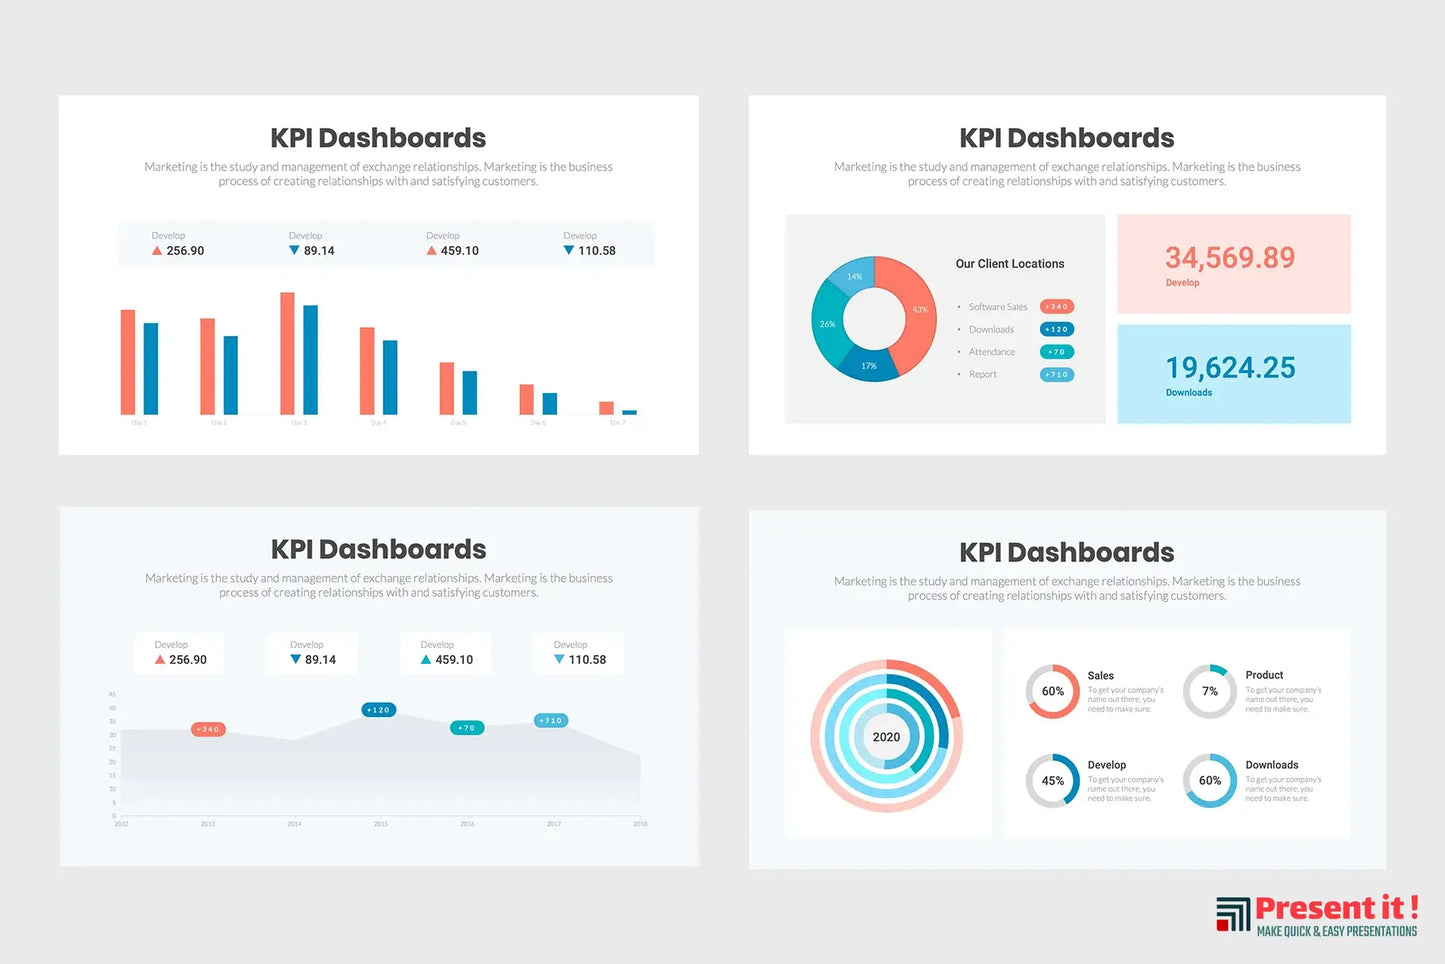
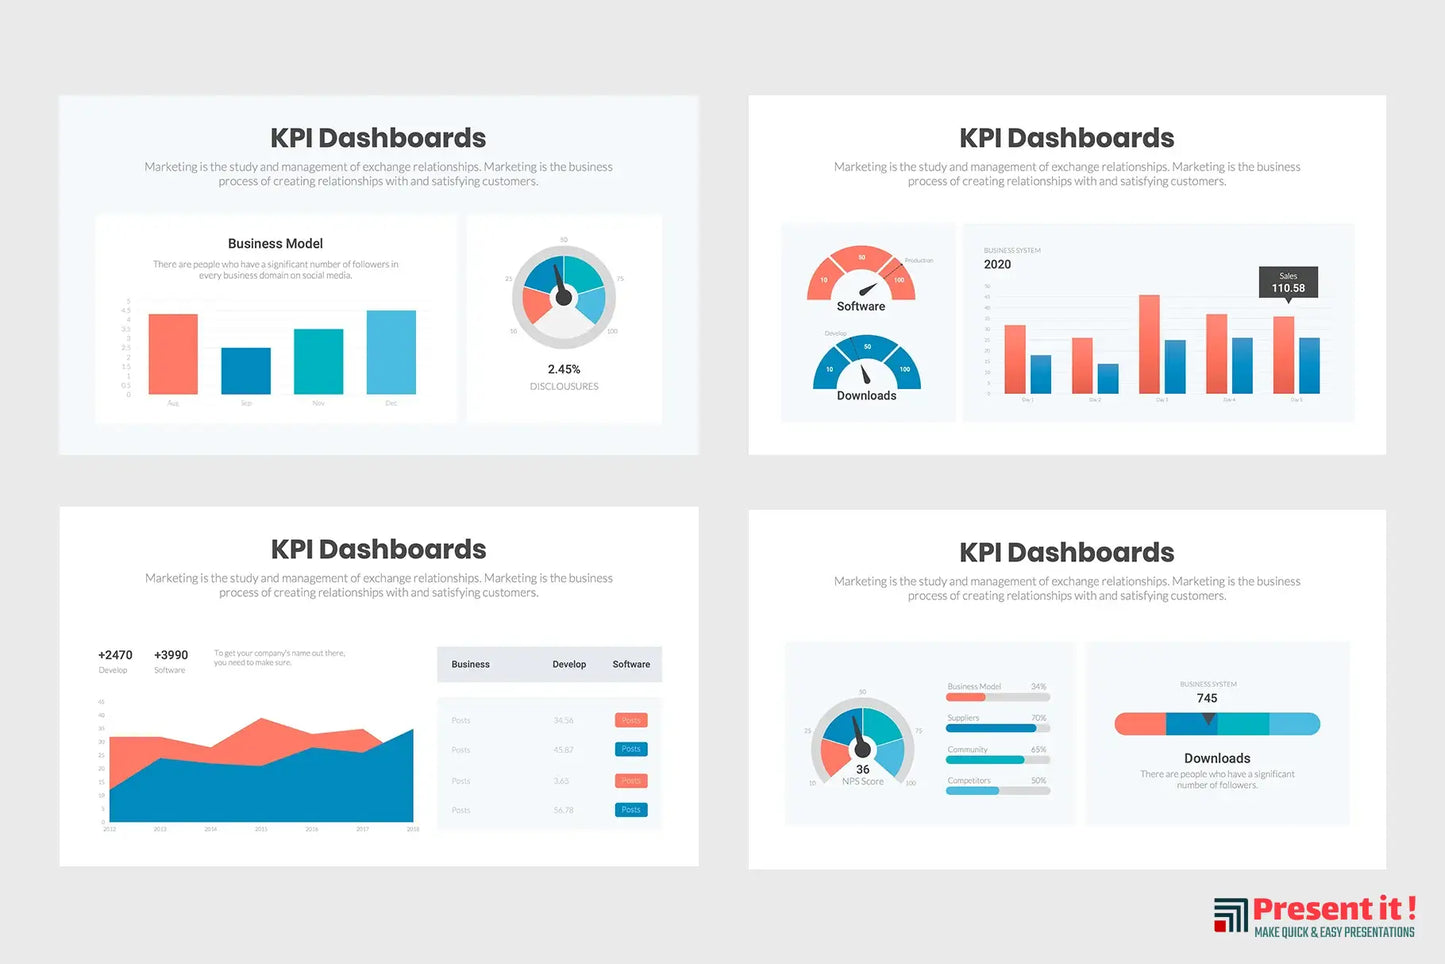
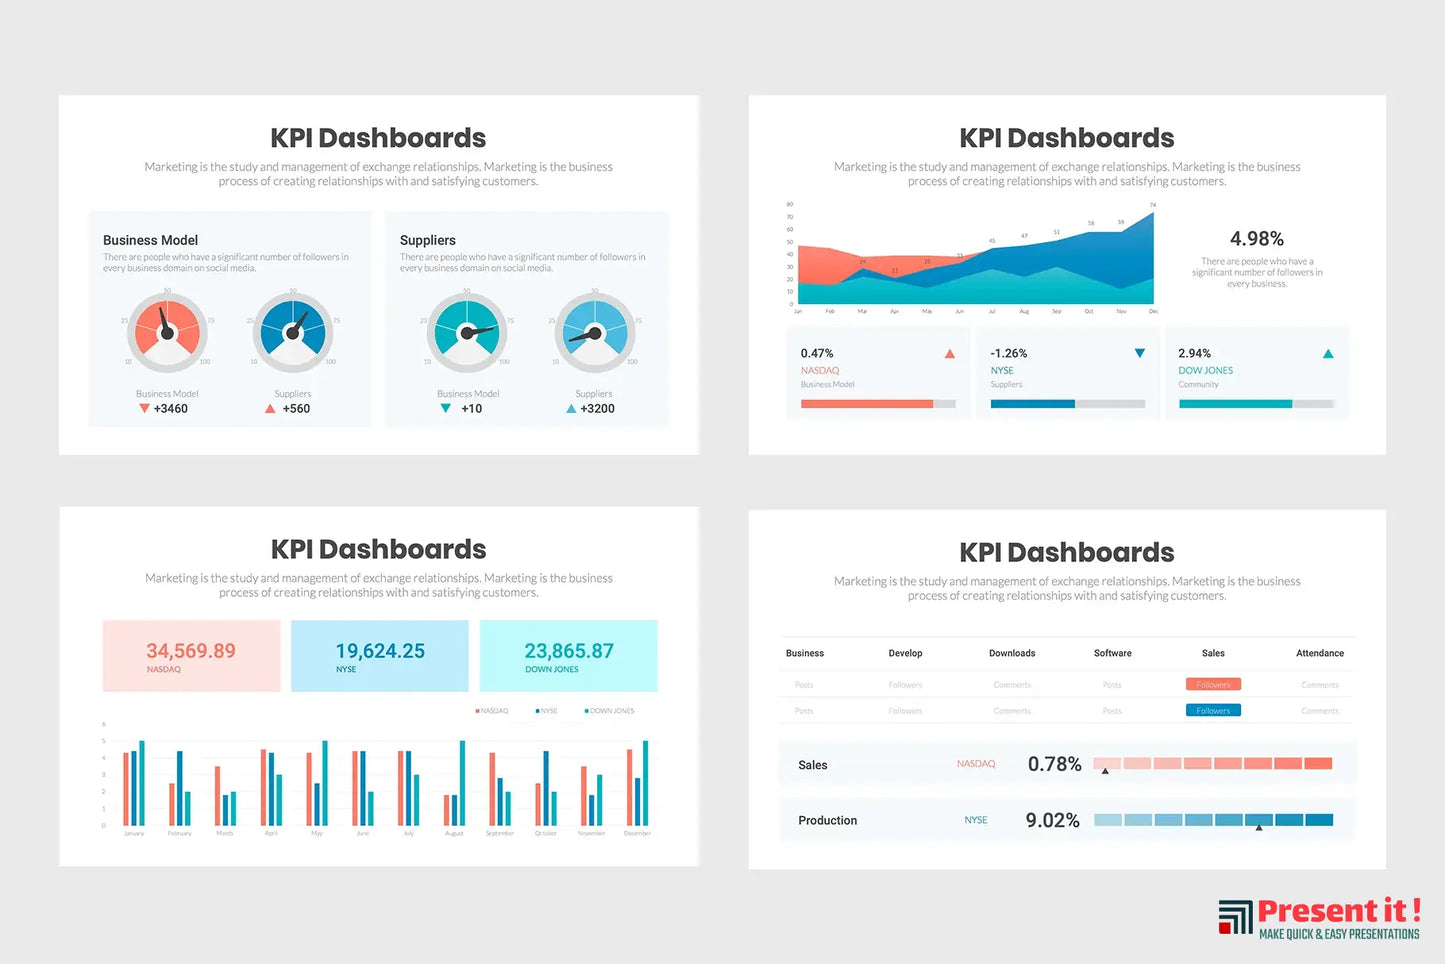
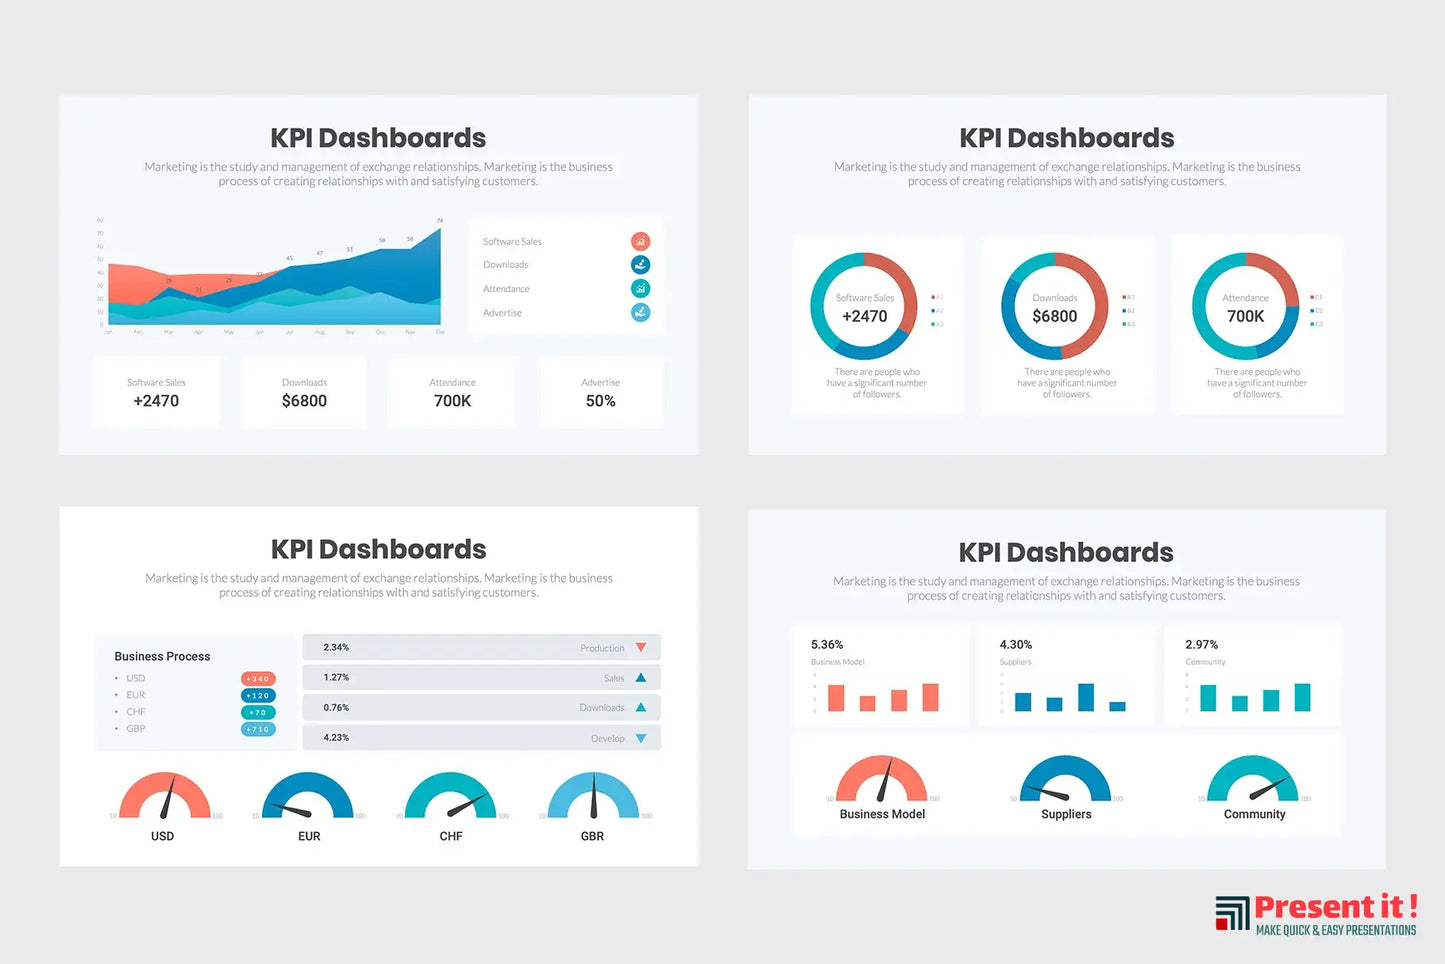
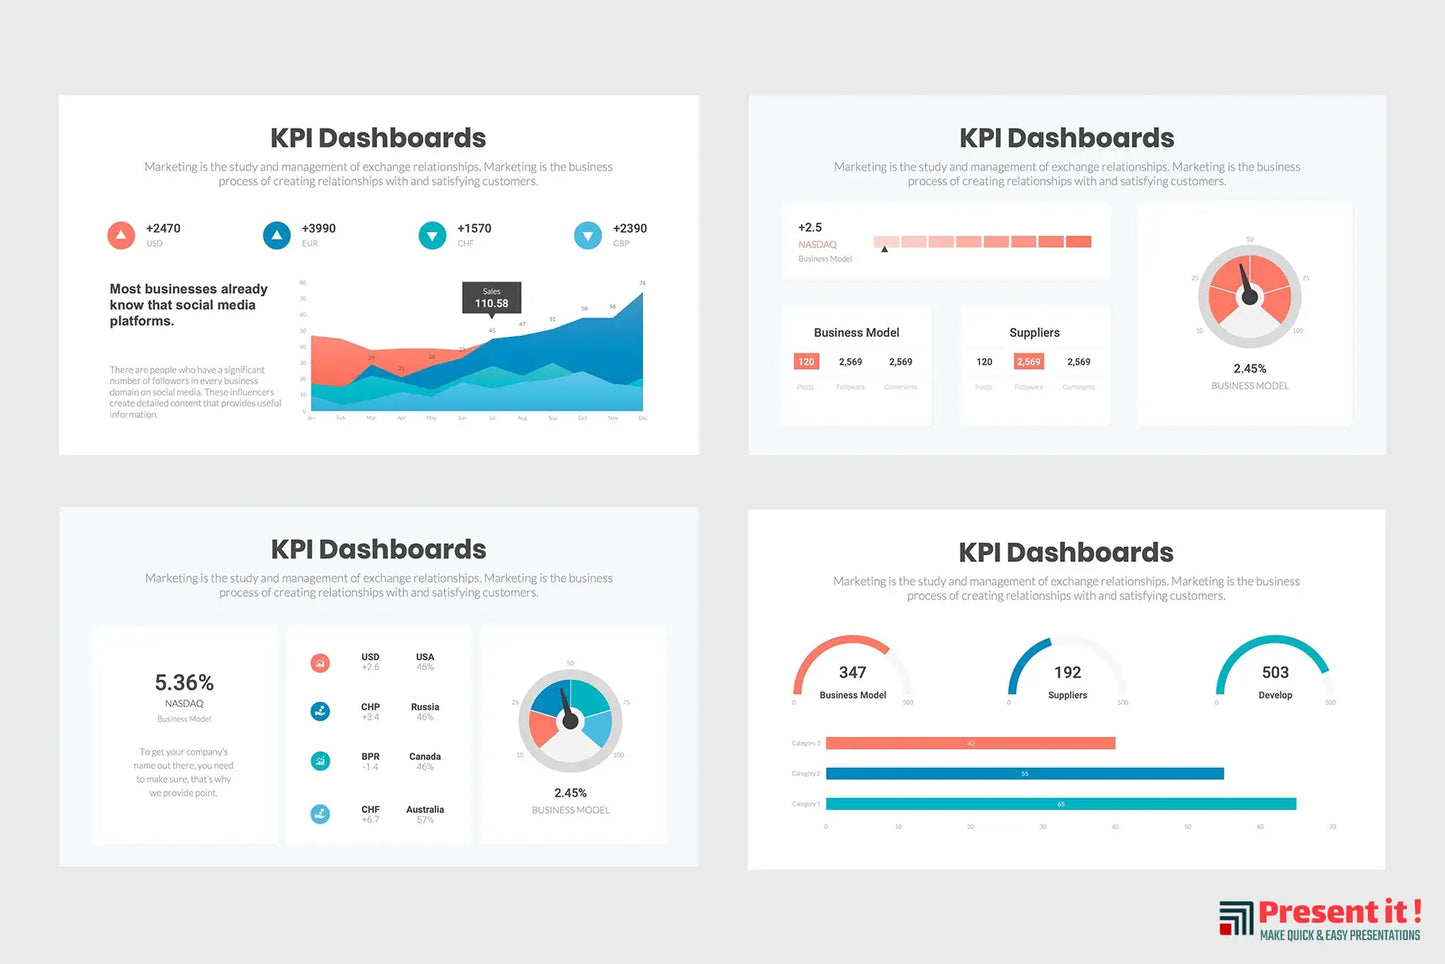
KPI Dashboard Infographics help to break down complex financial information into small, manageable numbers and pie charts that are color-coded. They make it easy for everyone in your organization or business to understand the overall performance of the company. All KPI Dashboard infographics are customizable and personalized within variety parameters.
These infographics are compatible with:
- MS PowerPoint
- Apple Keynote
- Google Slides
Features
Features
- Free Unique Slides and Master Slides
- Freemium Features
- Drag and Drop Ready
- Handmade Infographics
- Free Images Based on Template Category
- Free Icons
- Editable Elements and Fonts
Recommendations
Recommendations
This infographic template is great for a variety of presentations like:
- Providing a quick overview of a topic
- Explaining a complex process
- Displaying research findings or survey data
- Summarizing a long report
- Comparing multiple options
- Raising awareness about an issue or cause
KPI Dashboard Infographics
KPI Dashboard Infographics
Regular price
$4.99 USD
Regular price
$7.99 USD
Sale price
$4.99 USD
Unit price
/
per
Couldn't load pickup availability
About the product
About the product
Features
Features
- Free Unique Slides and Master Slides
- Freemium Features
- Drag and Drop Ready
- Handmade Infographics
- Free Images Based on Template Category
- Free Icons
- Editable Elements and Fonts
Recommendations
Recommendations
This infographic template is great for a variety of presentations like:
- Providing a quick overview of a topic
- Explaining a complex process
- Displaying research findings or survey data
- Summarizing a long report
- Comparing multiple options
- Raising awareness about an issue or cause
Product Specs
May 6, 2022
May 23, 2023
Ms. PowerPoint, Google Slides, Keynote
