About the product
About the product
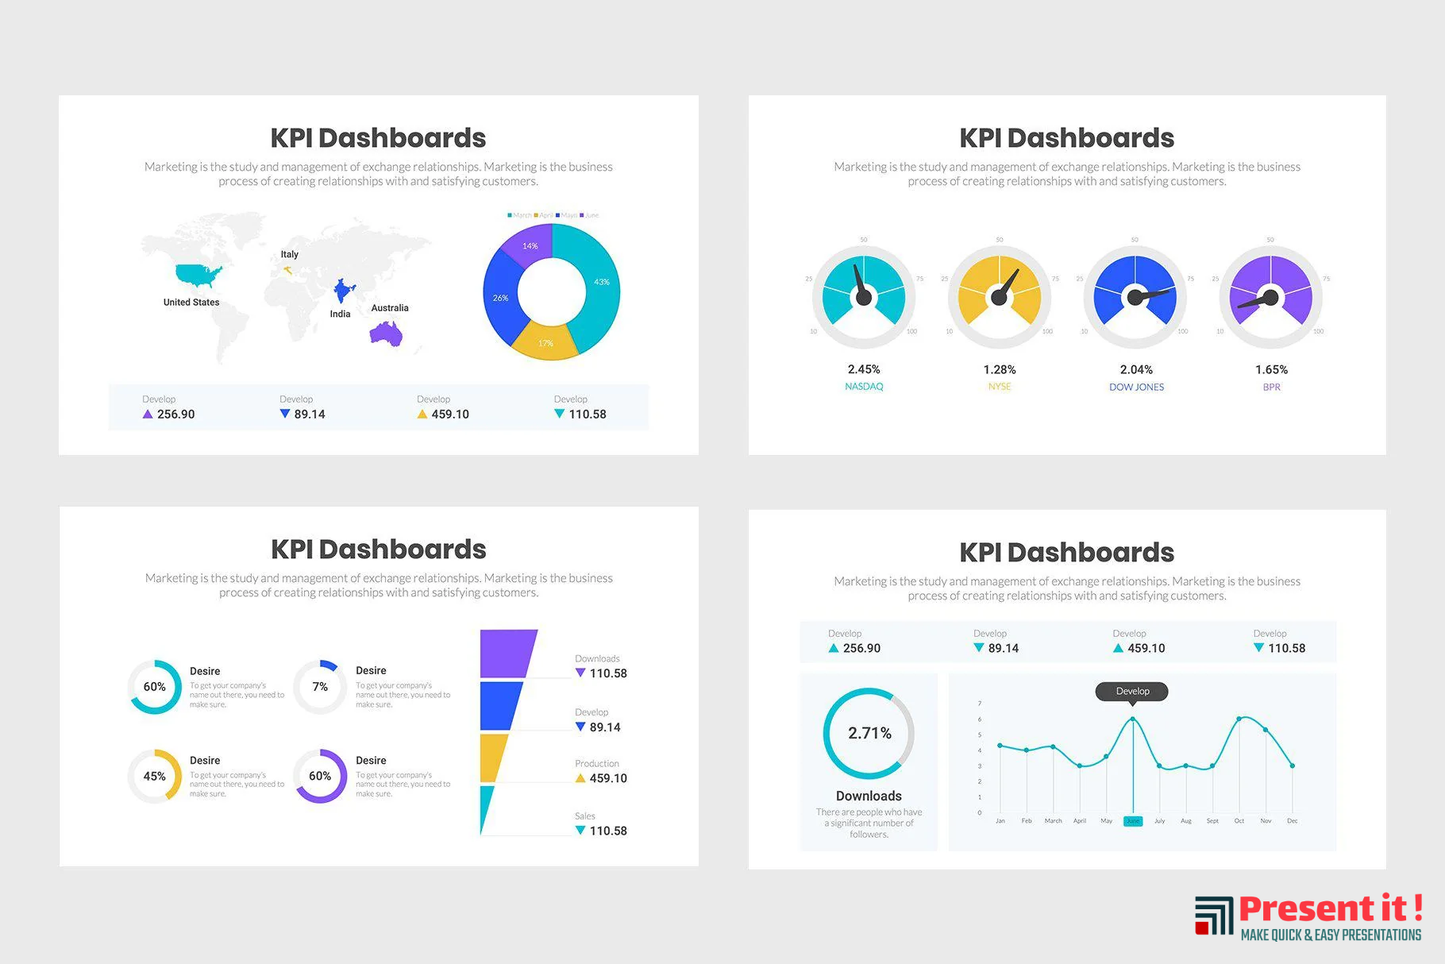
As your business grows, you will need to be able to track its productivity, your employees’ performance, and more as you try to reach different business goals. Using our KPI Dashboard infographic template will allow you to do just that and much more in an efficient and organized manner.
The abbreviation KPI stands for ‘key performance indicator,’ which means that you can use it to track how projects you have implemented are performing. Additionally, you can use KPI infographics to see how departments and individuals are performing. This will help you to learn how to increase productivity, as well as see what is failing or not performing so well. As a result, you will have better chances to come up with ways to fix those issues and become more productive, give your employees and staff a better understanding of what is expected of them.
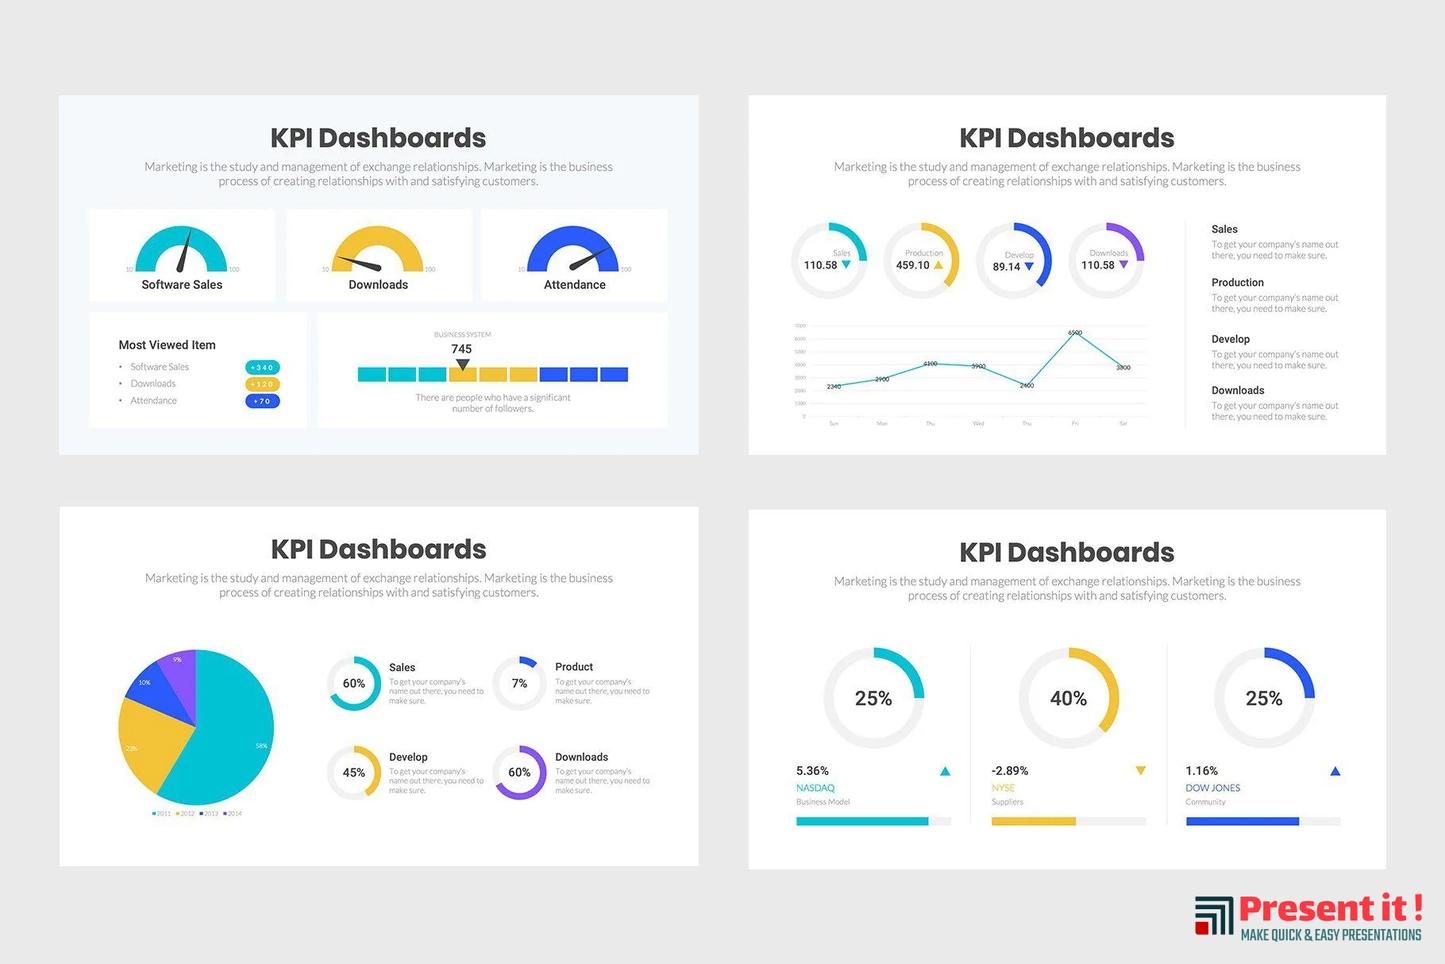
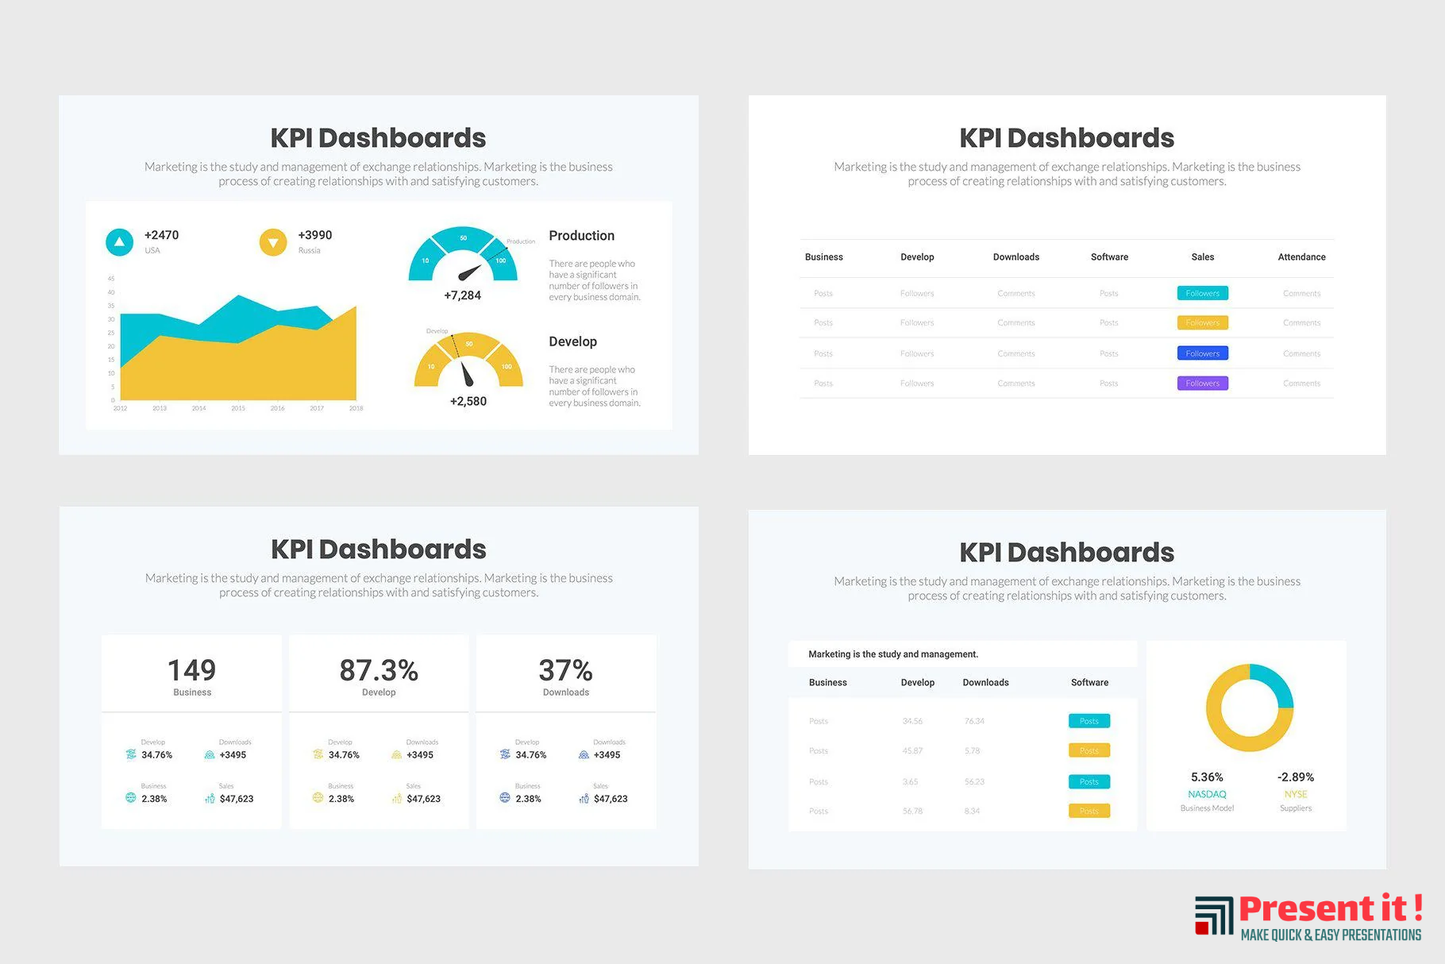
The KPI Dashboard presentation templates will allow you to organize all of this information with no difficulty. You will be able to input information about the goals you are set to achieve, as well as information about when they need to be completed and how. Then, you can use the diagrams to keep track of everyone’s performance to see how well projects are being implemented in your company.
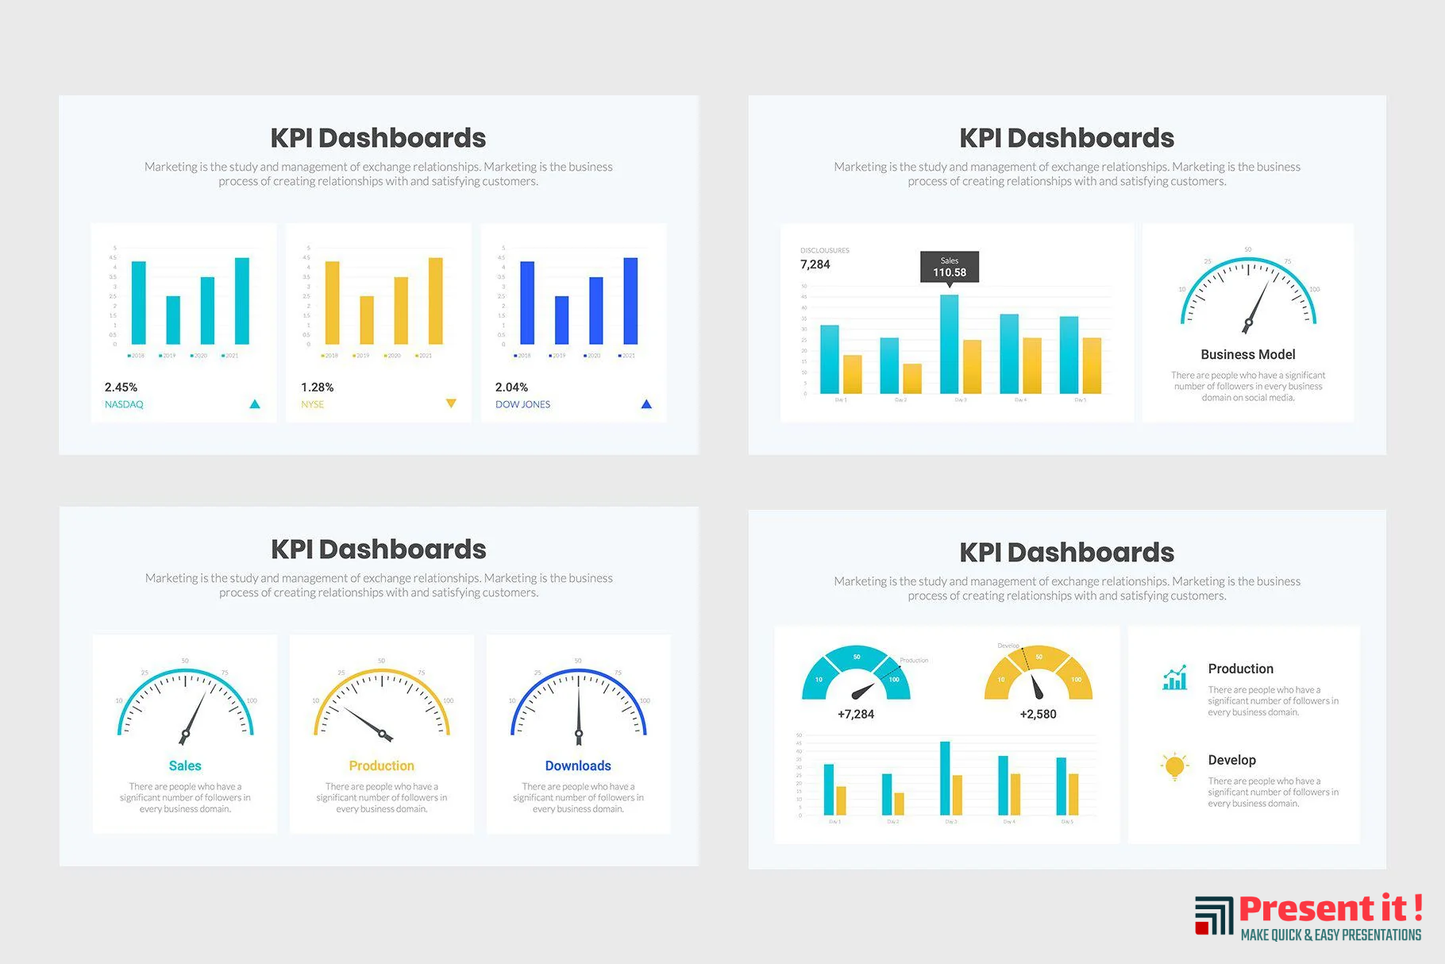
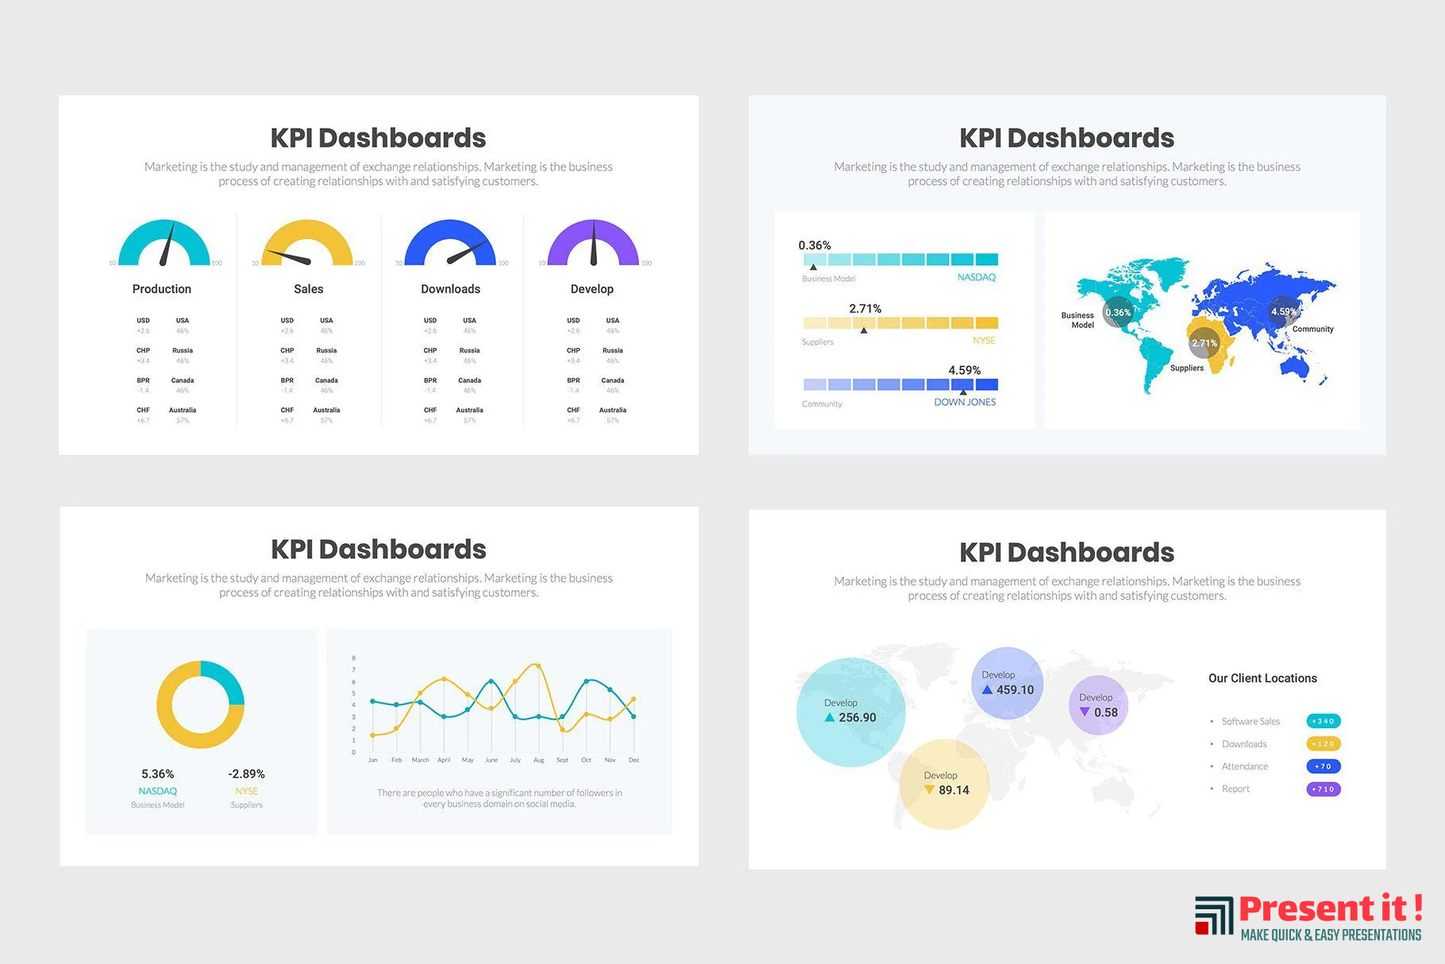
You will be surprised to see how organized our KPI Dashboards templates allow numerical data to be represented in the way that everyone can understand what they are looking at. Simply copy and paste the information that you need in the template and you’re ready to go.
Features:
- PowerPoint Files
- Apple Keynote Files
- Google Slides
Features
Features
- Free Unique Slides and Master Slides
- Freemium Features
- Drag and Drop Ready
- Handmade Infographics
- Free Images Based on Template Category
- Free Icons
- Editable Elements and Fonts
Recommendations
Recommendations
This infographic template is great for a variety of presentations like:
- Providing a quick overview of a topic
- Explaining a complex process
- Displaying research findings or survey data
- Summarizing a long report
- Comparing multiple options
- Raising awareness about an issue or cause